Documentation/Platforms/OpenRISC: Difference between revisions
mNo edit summary |
No edit summary |
||
| Line 3: | Line 3: | ||
== Full system emulation == | == Full system emulation == | ||
To boot linux you can run the following. | To boot linux you can run the following. If you are starting out you can download the OpenRISC test image from [[Testing/System_Images]]. | ||
qemu-system-or1k -cpu or1200 -M or1k-sim -kernel $LINUX/vmlinux -serial stdio -nographic -monitor none | qemu-system-or1k -cpu or1200 -M or1k-sim -kernel $LINUX/vmlinux -serial stdio -nographic -monitor none | ||
| Line 32: | Line 32: | ||
-gdb tcp::10001 | -gdb tcp::10001 | ||
To get good traces you can also add the following, this will output trace info the | To get good traces you can also add the following, this will output trace info to the file <tt>trace.txt</tt> | ||
-D | -D trace.txt -d in_asm,exec,int,op_opt | ||
== Pictures == | == Pictures == | ||
Revision as of 16:03, 23 February 2017
Description
OpenRISC is an open source processor architecture. While instruction sets like x86 are proprietary and owned by a single company, OpenRISC is free. Its main use is as a processor on an embedded system.
Full system emulation
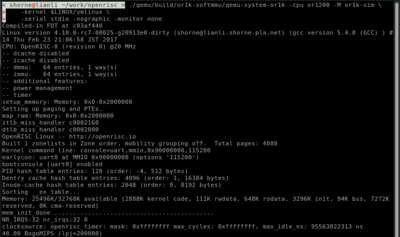
To boot linux you can run the following. If you are starting out you can download the OpenRISC test image from Testing/System_Images.
qemu-system-or1k -cpu or1200 -M or1k-sim -kernel $LINUX/vmlinux -serial stdio -nographic -monitor none
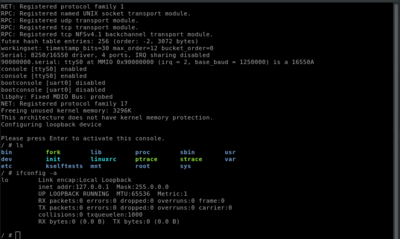
For networking support you can add the following options, note the open_eth option requires an out of tree driver from openrisc/linux.
-device open_eth -netdev tap,id=or1k
User mode emulation
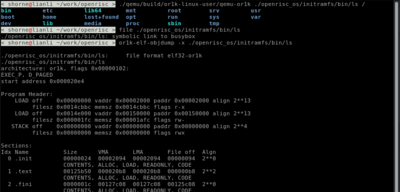
Using QEMU user mode emulation we can run and debug OpenRISC binaries on your host linux.
 $ cat main.c
 #include <stdio.h>
 int main() {
    printf ("hello\n");
    return 0;
 }
 $ or1k-linux-musl-gcc main.c
 # Here $LDPATH/lib/ld-musl-or1k.so.1 is linked to or1k-linux-musl/lib/libc.so
 $ qemu-or1k -L $LDPATH ./a.out
 hello
Debugging Tips
For debugging openrisc can listen on a gdb stub port with the following options
-gdb tcp::10001
To get good traces you can also add the following, this will output trace info to the file trace.txt
-D trace.txt -d in_asm,exec,int,op_opt
Pictures
Links
- Video introducing OpenRISC
- The OpenRISC project site
- OpenRISC 1000 specification
- GCC toolchain releases and binaries
Contacts
Maintainer: Jia Liu


