Internships/ProjectIdeas/TCGCodeQuality
Measure Tiny Code Generation Quality
Status: Vanderson M. do Rosario <vandersonmr2@gmail.com> (vanderson on #qemu IRC) is working on this project for 2019 GSoC.
Mentor: Alex Bennée <alex.bennee@linaro.org> (stsquad on #qemu IRC)
Project Github: vandersonmr/gsoc-qemu [1]
Summary: in most applications, the majority of the execution time is spent in a very small portion of code. Regions of a code which have high-frequency execution are called hot while all other regions are called cold. As a direct consequence, emulators also spent most of their execution time emulating these hot regions and, so, dynamic compilers and translators need to pay extra attention to them. To guarantee that these hot regions are compiled/translated generating high-quality code is fundamental to achieve a final high-performance emulation. Thus, one of the most important steps in tuning an emulator performance is to identify which are the hot regions and to measure their translation quality.
TBStatsitics (TBS)
Improving the code generation of the TCG backend is a hard task that involves reading through large amounts of text looking for anomalies in the generated code. It would be nice to have tools to more readily extract and parse code generation information. This would include options to dump:
- The hottest Translations Blocks (TB) and their execution count (total and atomic).
- Translation counters:
- The number of times a TB has been translated, uncached and spanned.
- The amount of time spent doing such translations and optimizations.
- Code quality metrics:
- The number of TB guest, IR (TCG ops), and host instructions.
- The Number of spills during the register allocation.
For that reason, we collect all this information dynamically for every TB or for a specific set of TBs and store it on TBStatistics structures. Every TB can have one TBStatistics linked to it by a new field inserted in the TranslationBlock structure[2]. Moreover, TBStatistics are not flushed during tb_flush and they survive longer being able to be relinked to retranslated TBs using their keys (phys_pc, pc, flags, cs_base) to matches new TBs and their TBStats.
Not all stats in a TBStatistics need to be being collected. The stats_enabled flag can be used to set which stats are going to be collected/are enabled to a particular TBStatistics. The possible flags can be found in quemu-commons.h and they are: TB_NOTHING, TB_EXEC_STATS (to collect code and translations stats), TB_JIT_STATS (to collect executions stats), TB_JIT_TIME (to collect time stats) and TB_PAUSED.
struct TBStatistics {
    tb_page_addr_t phys_pc;
    target_ulong pc;
    uint32_t     flags;
    /* cs_base isn't included in the hash but we do check for matches */
    target_ulong cs_base;

    uint32_t stats_enabled;

    /* Execution stats */
    struct {
        unsigned long normal;
        unsigned long atomic;
        /* filled only when dumping x% cover set */
        uint16_t coverage;
    } executions;

    struct {
        unsigned num_guest_inst;
        unsigned num_tcg_ops;
        unsigned num_tcg_ops_opt;
        unsigned spills;

        /* CONFIG_PROFILE */
        unsigned temps;
        unsigned deleted_ops;
        unsigned in_len;
        unsigned out_len;
        unsigned search_out_len;
    } code;

    struct {
        unsigned long total;
        unsigned long spanning;
    } translations;

    struct {
        int64_t restore;
        uint64_t restore_count;
        int64_t interm;
        int64_t code;
        int64_t opt;
        int64_t la;
    } time;

    /* HMP information - used for referring to previous search */
    int display_id;

    /* current TB linked to this TBStatistics */
    TranslationBlock *tb;
};
Creating and Storing TBStats
When a TB is going to be created in tb_gen_code, we check if the CPU_LOG_HOT_TBS is set and if the TB entry address (tb->pc) is in the range of interest[3]. If so, the tb_get_stats is called which can create a new TBStatistic (if no other if the same keys exist) or return an existing one. The tb_get_stats function creates TBStatistics structures and stores them in a qht hash table in the TBContext[4].
   if (qemu_loglevel_mask(CPU_LOG_HOT_TBS) && qemu_log_in_addr_range(tb->pc))
       tb->tb_stats = tb_get_stats(phys_pc, pc, cs_base, flags);
Collecting/Filling TBStatistics Information
To fill the fields in the TBStatistics dynamically, different parts of the code need to be changed. We list here how we collect the information for each field.
Execution Count - Hotness
To collect the execution count of each TB, we instrument the begin of each one of them, adding a call to a helper function called exec_freq. This is done by the gen_tb_exec_count function. The exec_freq helper receives the address of the TBStatistic structure linked to the TB.
include/exec/gen-icount.h:
static inline void gen_tb_exec_count(TranslationBlock *tb)
{
    if (qemu_loglevel_mask(CPU_LOG_HOT_TBS) && tb->tb_stats) {
        TCGv_ptr ptr = tcg_const_ptr(tb->tb_stats);
        gen_helper_inc_exec_freq(ptr);
        tcg_temp_free_ptr(ptr);
    }
}
The helper function access the field executions.total of the TBStatistic structure and increment it atomically counting the execution of the TB.
accel/tcg/tcg-runtime.c:
void HELPER(inc_exec_freq)(void *ptr)
{
    TBStatistics *stats = (TBStatistics *) ptr;
    g_assert(stats);
    atomic_inc(&stats->executions.total);
}
Spanning
Every time a TB spans we atomically increment the translations.spanning field.
accel/tcg/translate-all.c:
TranslationBlock *tb_gen_code(CPUState *cpu,
                            target_ulong pc, target_ulong cs_base,
                            uint32_t flags, int cflags)
   ...
   if ((pc & TARGET_PAGE_MASK) != virt_page2) {
        phys_page2 = get_page_addr_code(env, virt_page2);
        if (tb->tb_stats) {
            atomic_inc(&tb->tb_stats->translations.spanning);
        }
   }
   ...
Guest Instructions
The guest instructions are already counted in the DisasContextBase in the translator_loop, so we simply copy it to the code.num_guest_inst.
accel/tcg/translator.c:
void translator_loop(const TranslatorOps *ops, DisasContextBase *db,
                     CPUState *cpu, TranslationBlock *tb, int max_insns)
   ....
   db->tb->tb_stats->code.num_guest_inst = db->num_insns;
   ....
Host Instructions
As there is no function which only counts the number of instruction using the disassembler, we adapt the disas function in a get_num_insts which returns the number of instructions of any assembly of the supported architectures. The difference between both functions is that the second one uses a fake fprintf which do nothing, so it iterates over the assembly, counting the instructions but without printing them.
accel/tcg/translate-all.c:
TranslationBlock *tb_gen_code(CPUState *cpu,
                             target_ulong pc, target_ulong cs_base,
                             uint32_t flags, int cflags)
   ...
   size_t code_size = gen_code_size;
   if (tcg_ctx->data_gen_ptr) {
        code_size = tcg_ctx->data_gen_ptr - tb->tc.ptr;
   }
   qemu_log_lock();
   atomic_set(&tb->tb_stats->code.num_host_inst,
                get_num_insts(tb->tc.ptr, code_size));
   qemu_log_unlock();
   ...
disas.c:
static int fprintf_fake(struct _IO_FILE *a, const char *b, ...)
{
   return 1;
}

unsigned get_num_insts(void *code, unsigned long size)
{
   CPUDebug s;
   ...
   s.info.fprintf_func = fprintf_fake;
   unsigned num_insts = 0;
   for (pc = (uintptr_t)code; size > 0; pc += count, size -= count) {
       num_insts++;
       count = print_insn(pc, &s.info);
       if (count < 0) {
           break;
       }
   }
   return num_insts;
}
TCG Instructions
To count the number of TCG instructions we need only to iterate over the ops in the TCGContext and them store the result in the code.num_tcg_inst.
tcg/tcg.c:
int tcg_gen_code(TCGContext *s, TranslationBlock *tb)
  ....
  int n = 0;
  QTAILQ_FOREACH(op, &s->ops, link) {
      n++;
  }
  tb->tb_stats->code.num_tcg_inst = n;
  ....
Controling and Dumping TBStatistics
We added the -d hot_tbs which activates the collection of statistics of the TBs. In linux-user mode the hottest blocks are dumped at the end of the execution and they can be limited by passing a value just as: -d hot_tbs:value.
When in the system emulation mode, the collection of the statistics can be delayed and initiated using an HPM command: start_stats.
The command dfilter can also be used to limit the addresses in which the statistics will be collected and dumped.
To list the hottest TBs the command info tbs can be used. This command can also receive as parameter the number of tbs to be dumped and by which metric it will be sorted: hotness, hg (host/guest), or spills. Follows an example of the output:
info tb-list
TB id:1 | phys:0x34d54 virt:0x0000000000034d54 flags:0x0000f0
	| exec:4828932/0 guest inst cov:16.38%
	| trans:1 ints: g:3 op:82 op_opt:34 spills:3
	| h/g (host bytes / guest insts): 90.666664
	| time to gen at 2.4GHz => code:3150.83(ns) IR:712.08(ns)
	| targets: 0x0000000000034d5e (id:11), 0x0000000000034d0d (id:2)

TB id:2 | phys:0x34d0d virt:0x0000000000034d0d flags:0x0000f0
	| exec:4825842/0 guest inst cov:21.82%
	| trans:1 ints: g:4 op:80 op_opt:38 spills:2
	| h/g (host bytes / guest insts): 84.000000
	| time to gen at 2.4GHz => code:3362.92(ns) IR:793.75(ns)
	| targets: 0x0000000000034d19 (id:12), 0x0000000000034d54 (id:1)

TB id:3 | phys:0xec1c1 virt:0x00000000000ec1c1 flags:0x0000b0
	| exec:872032/0 guest inst cov:1.97%
	| trans:1 ints: g:2 op:56 op_opt:26 spills:1
	| h/g (host bytes / guest insts): 68.000000
	| time to gen at 2.4GHz => code:1692.08(ns) IR:473.75(ns)
	| targets: 0x00000000000ec1c5 (id:4), 0x00000000000ec1cb (id:13)
If necessary to iteratively examine one of this listed tbs the info tb id command can be used, where the id is the same as the ones listed by info tbs. The following example shows the result of dumping the guest instructions of tb 1, but also guest and TCG op instructions can be dumped by passing a second argument.
info tb
TB id:2 | phys:0x34d0d virt:0x0000000000034d0d flags:0x0000f0
	| exec:6956495/0  guest inst cov:21.82%
	| trans:2 ints: g:2 op:40 op_opt:19 spills:1
	| h/g (host bytes / guest insts): 84.000000
	| time to gen at 2.4GHz => code:3130.83(ns) IR:722.50(ns)
	| targets: 0x0000000000034d19 (id:12), 0x0000000000034d54 (id:1)

----------------
IN:
0x00034d0d:  89 de                    movl     %ebx, %esi
0x00034d0f:  26 8b 0e                 movl     %es:(%esi), %ecx
0x00034d12:  26 f6 46 08 80           testb    $0x80, %es:8(%esi)
0x00034d17:  75 3b                    jne      0x34d54

------------------------------
info coverset
Finally, there is an option to dump not the "n" hottest blocks but all necessary hot blocks to achieve m% of the total execution counting (info coverset m). Moreover, this is a useful metric to understand the execution footprint of a program, with more dense applications having a smaller number of blocks to achieve m% of the execution.
TB id:1 | phys:0x34d54 virt:0x0000000000034d54 flags:0x0000f0
	| exec:5202686/0 guest inst cov:11.28%
	| trans:1 ints: g:3 op:82 op_opt:34 spills:3
	| h/g (host bytes / guest insts): 90.666664
	| time to gen at 2.4GHz => code:2793.75(ns) IR:614.58(ns)
	| targets: 0x0000000000034d5e (id:3), 0x0000000000034d0d (id:2)

TB id:2 | phys:0x34d0d virt:0x0000000000034d0d flags:0x0000f0
	| exec:5199468/0 guest inst cov:15.03%
	| trans:1 ints: g:4 op:80 op_opt:38 spills:2
	| h/g (host bytes / guest insts): 84.000000
	| time to gen at 2.4GHz => code:2958.75(ns) IR:719.58(ns)
	| targets: 0x0000000000034d19 (id:4), 0x0000000000034d54 (id:1)

------------------------------
2 TBs to reach 25% of guest inst exec coverage
Total of guest insts exec: 138346727

------------------------------
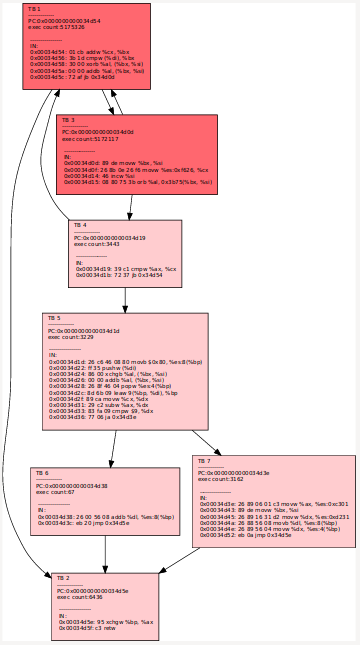
info cfg
Overheads
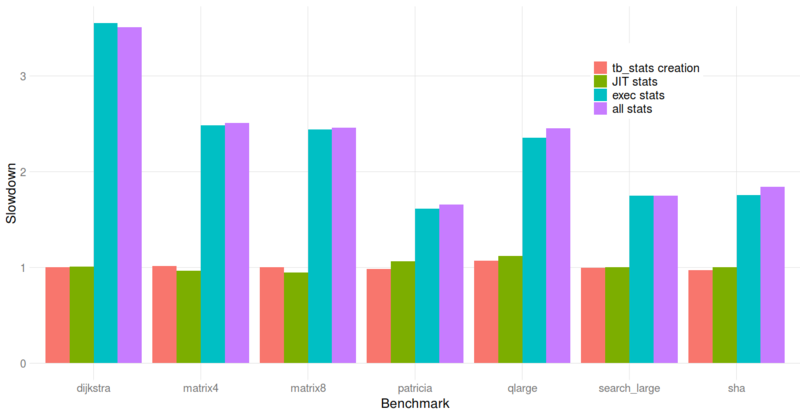
To understand the overhead of collecting these statistics we executed some benchmarks using four configuration variations in the qemu-x86-64-linux-user:
- baseline: without any modification.
- tb_stats creation: with the creation of tb_stats enabled.
- jit stats: with the collection of JIT code and translation stats enabled.
- exec stats: with the collection of exec count enabled.
- all stats: with both exec count and JIT code/translation enabled.
All values below are the median of 10 executions and they are all slowdowns in relation to the baseline value.
The average slowdowns were: 0.7% for tb_stats creation, 1.7% for jit stats, 227% for exec stats and 231% for all.
TODO: collect and compare memory usage.
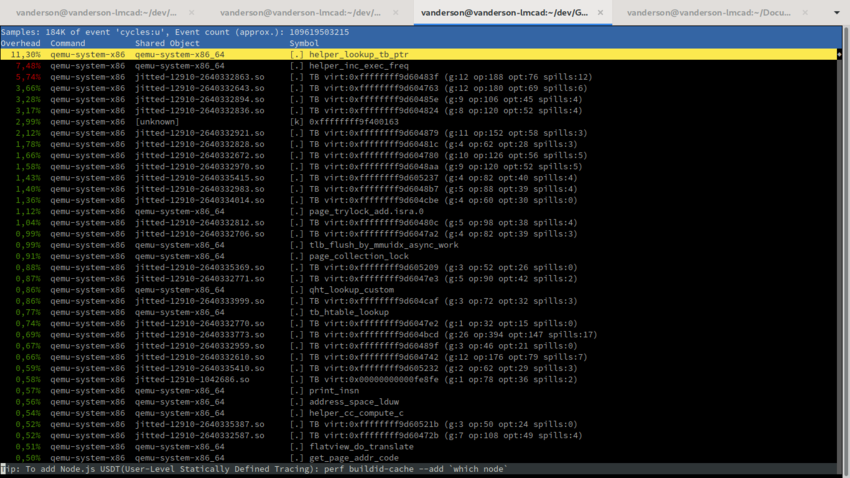
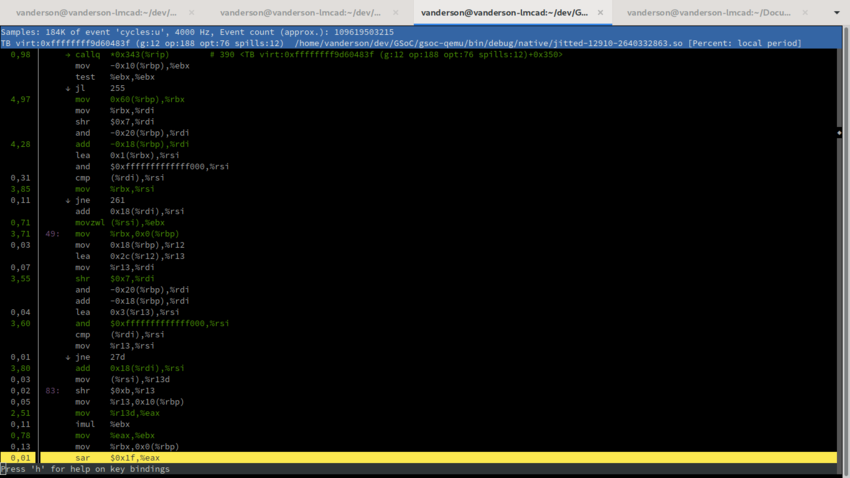
Linux Perf Integration
How to use:
perf record -k 1 qemu-x86_64 -perf ./a.out
perf inject -j -i perf.data -o perf.data.jitted
perf report -i perf.data.jitted
Future Work
Future work would include:
- elide or beautify common blocks like softmmu access macros (which are always the same)
- develop a safe way of collecting the gen host instructions count.
- QEMU currently only works on translating simple basic blocks with one or two exit paths. This work could be a pre-cursor to supporting Internships/ProjectIdeas/Multi-exit Hot Blocks in the future.


